Southern Nevada Urban Heat Mapping Project
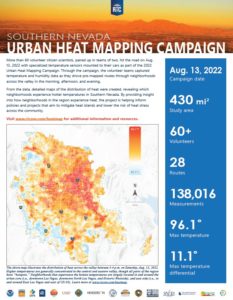
More than 60 volunteer citizen scientists, paired up in teams of two, hit the road on Saturday, Aug. 13, 2022 with sensors mounted to their cars to capture temperature data across the valley as part of the 2022 Urban Heat Mapping Campaign.
Through the campaign, the volunteer teams were provided with specialized sensors that collected temperature and humidity data as they drove pre-mapped routes in the morning, afternoon, and evening.
From the data, detailed maps of the distribution of heat across the valley were created, revealing which neighborhoods in Southern Nevada are hottest. By providing insight into how neighborhoods in experience heat, the project is helping inform policies and projects that aim to mitigate heat islands and lower the risk of heat stress across the community.
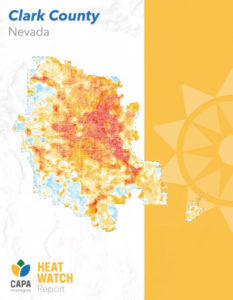
Click here to view the Summary Report.
Results
Interactive Map
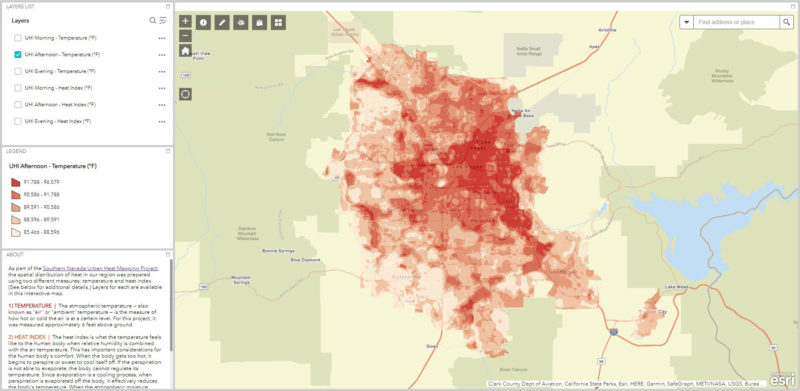
As part of the Southern Nevada Urban Heat Mapping Project, maps detailing the spatial distribution of heat in our region were prepared using two different measures: temperature and heat index. An interactive web-based map, which includes temperature and heat index layers, that can be accessed by clicking below.
Higher temperatures are generally concentrated in the central and eastern valley, though all parts of the region have “hotspots.” Neighborhoods that experience the hottest temperatures are largely located in and around the urban core (i.e., downtown Las Vegas, downtown North Las Vegas, and Historic Westside), and east side (i.e., in and around East Las Vegas and east of US-95).
Most of the areas that experience the hottest temperatures lack high concentrations of dense vegetation, and in general, feature large amounts of dark and impermeable surfaces, like parking lots, buildings, and asphalt. Vegetation, such as trees and shrubs, can be a natural source of shade and facilitate evaporation, which results in a cooling effect. Vegetated surfaces also absorb less heat than impervious surfaces. Developed land, which replaces natural land and vegetation with impervious surfaces (such as paved roads, parking lots, and buildings), retains heat and takes longer to cool than natural surfaces. These surfaces have been shown to be strongly related to increased surface temperatures and a contributor to urban heat islands.
Additionally, because elevation drops by as much as 2,000 feet from west to east in developed areas of the region, the valley’s east side also experiences naturally higher temperatures.
At a Glance

Project Deliverables & Additional Results
Data downloads
- Rasters of temperature and heat index (.tif)
- Route point data (.shp)
- Stationary sensor logs (.csv)
About
Project Overview
Southern Nevada was one of 14 locations nationwide awarded a grant from the National Oceanic and Atmospheric Administration (NOAA) to conduct a community science urban heat island mapping campaign in the summer of 2022. For more information, read NOAA’s press release.
Learn more about the 2022 locations, as well as previous NOAA UHI Mapping Campaigns.
This opportunity allowed our region to study the impacts of extreme heat and inform local strategies to alleviate the impacts of heat across the community. The Southern Nevada Urban Heat Mapping Project builds on previous and ongoing heat-related work conducted in our region, including:
- RTC’s Southern Nevada Extreme Heat Vulnerability Analysis
- Guinn Center’s Strengthening Heat Resiliency in Communities of Color in Southern Nevada
- Clark County’s All-In Sustainability and Climate Action Plan
The Southern Nevada campaign was among the largest completed through this effort – both in terms of project area (430 square miles) and number of routes needed to cover the project area (28).
Community Involvement

A volunteer team posing with a temperature sensor.
A key aspect of the heat mapping campaigns is community involvement. To capture the data used to reveal which neighborhoods are hottest, project organizers are expected to recruit volunteer teams to drive pre-mapped routes three times on a hot day with temperature sensors mounted to their vehicles. Routes are driven from 6-7 a.m., 3-4 p.m., and 7-8 p.m.
Through an extensive outreach and recruitment effort, the community interest in the project far surpassed organizers’ expectations. The pool of interested volunteers exceeded 300, though only around 60 were needed for the project. In an effort to engage residents most impacted by extreme heat in Southern Nevada, priority was given to those who live in ZIP codes with the highest rates of heat-related health incidents.
Volunteers who participated in the project were compensated with gift cards for their time and to help cover the gas used during the campaign. For every route completed, each team member received a $30 VISA gift card.
Campaign Day
On Saturday, Aug. 13, the project team and more than 60 volunteers completed the data collection portion of the heat mapping campaign, albeit during less-than-optimal weather conditions. Ideally, the campaign would have occurred on a day representative of a Vegas summer – a dry day with temperatures in the triple-digits, minimal cloud cover and low humidity. But mother nature didn't cooperate. Due to one of the strongest monsoon seasons in recent history, much of July and most of August were cooler, wetter, and more humid than normal. In fact, the region experienced record levels of moisture in atmosphere in August.
Even with daily calls with the local National Weather Service (NWS) office for up-to-date forecasts, the campaign day featured heavy cloud cover, high humidity, and an observed high of only 90 degrees (at the NWS observation station at Harry Reid International Airport). The normal high for Aug. 13 is 103 degrees. Brought on by thunderstorms the night prior that occurred around (but not in) the Las Vegas valley, unexpected heavy cloud cover occurred across the region at levels between 80 to 100 percent in the morning and 60 to 80 percent throughout the rest of the day. Humidity levels also ranged between 40-70 percent over the course of the day.
Despite the atypical weather, the volunteers still collected valuable data. During the course of the day, more than 138,000 temperature/humidity measurements were captured and used to generate high-resolution maps that reveal the spatial distribution of heat in our region. And while substandard weather may have dampened the range of temperatures normally experienced on a hot day across the region, after further analysis, the project consultant was confident the areas shown to experience relatively greater levels of heat would be similar during more typical circumstances as well.
Background
Over the past five years, NOAA has funded CAPA Strategies to support 35 communities across the U.S. (see map at right) in mapping their urban heat islands. CAPA has developed a process to help cities plan and execute a volunteer-based community science field campaign that builds upon local partnerships, and engages residents in a scientific study to map and understand how heat is distributed in their communities.
CAPA uses data captured during the campaigns to produce high-quality outputs that have been used in sustainability plans, public health practices, urban forestry, research projects, and other engagement activities. These community science field campaigns have also been the used to raise awareness about the many impacts of extreme heat and the factors that may affect the uneven distribution of heat throughout communities.
The final product of the community science field campaigns is a set of high resolution air temperature and humidity data, and a report that provides a detailed analysis of distribution of heat in the morning, afternoon and evening. Interactive, high resolution web maps of the modeled air temperature and heat index are also provided. The maps are produced using a machine learning process that combines satellite imagery and air temperature and humidity readings collected by volunteers during the campaign. For more information, consult this recent publication on the mapping process.
NOAA’s heat mapping program is part of the Biden Administration’s Justice40 initiative, a whole-of-government effort to ensure that federal agencies work with states and local communities to make good on President Biden’s promise to deliver 40% of benefits from federal investment in climate and clean energy to disadvantaged communities. When NOAA was evaluating applications for the 2022 heat mapping campaigns, significant weight was given to applications emphasizing environmental justice.
Heat Islands & Extreme Heat
Heat islands are urbanized areas that experience higher temperatures largely due to their built environment. Buildings, roads and other infrastructure absorb and re-emit the sun’s heat more than natural landscapes, causing these areas to become “islands” of higher temperatures.
Extreme heat events cause more serious health incidents in the U.S. than any other climate-related hazard (including tornadoes, floods, and hurricanes), according to Centers for Disease Control and Prevention (CDC) estimates. In Southern Nevada, which has one of the hottest and fastest-warming climates in the country, serious heat-related health incidents have spiked in recent years. In 2021 alone, there were 245 heat-related fatalities in Southern Nevada – more than the number of homicides and traffic deaths in the same year.
By capturing on-the-ground temperature data across the valley, the Southern Nevada Urban Heat Mapping Project can provide insight into why these temperature patterns occur. Understanding how heat is distributed in our community can help to inform heat mitigation efforts, while addressing inequitable distribution of urban heat risk and vulnerability.
Partners
The Southern Nevada Urban Heat Mapping Project was a collaboration between resident volunteers and a number of Southern Nevada-area stakeholders. The Regional Transportation Commission of Southern Nevada (RTC) served as the project lead, with Clark County, UNLV, and Get Outdoors Nevada serving as project partners.
Support was also provided by the Nevada Minority Healthy and Equity Coalition, Southern Nevada Health District, Desert Research Institute, City of Las Vegas, City of Henderson, City of North Las Vegas, Boulder City, and Southern Nevada Water Authority, and REI.
Project Partners
News
- How maps can protect children from extreme heat (Sept. 19, 2023)
- Modified roofs, more green spaces among steps to cool Las Vegas’ urban heat island (Aug. 11, 2023)
- Heat mapping study helps protect Southern Nevadans from extreme climate (July 3, 2023)
- RTC adding shade shelters at bus stops to keep riders cooler in summer heat (June 15, 2023)
- New heat relief initiative kicks off at east valley park (May 12, 2023)
- Urban heat island effect ‘the silent killer’ has major impact on Las Vegas (April 19, 2023)
- RTC's heat mapping study reveals solutions to heat at bus stops (April 6, 2023)
- Heat mapping campaign finds hottest neighborhoods in Las Vegas valley (April 5, 2023)
- RTC heat mapping study to bring more innovative shade solutions to Las Vegas (April 5, 2023)
- RTC's heat mapping study pinpoints the hottest places in the valley (April 4, 2023)
- RTC of Southern Nevada finds initiatives matching findings of heat report (April 4, 2023)
- Federal project aims to reduce health effects of extreme heat in two Mountain West cities (Nov. 22, 2022)
- Pilot project builds equitable response to extreme heat in four cities (Nov. 14, 2022)
- Volunteers help map ‘urban heat islands’ in Las Vegas Valley (Aug. 16, 2022)
- RTC needs volunteers to help map and mitigate Las Vegas' urban heat island (July 12, 2022)
- What areas of Las Vegas are hottest? RTC looking for volunteers to map urban heat island (July 12, 2022)
- RTC is helping Nevadans beat the heat this summer (July 11, 2022)
- RTC organizing ‘heat island’ mapping project, and looking for volunteers (July 8, 2022)
- RTC heat vulnerability study recognized with national award; heat-related efforts to continue this summer (June 9, 2022)
- NOAA and communities to map heat inequities in 14 U.S. cities and counties (April 26, 2022)
Contact Us
Contact the RTC to learn more or request an accommodation:
Paul Gully
Principal Transportation Planner
[email protected] | 702-676-1714
For media inquiries, contact 702-676-1891.


